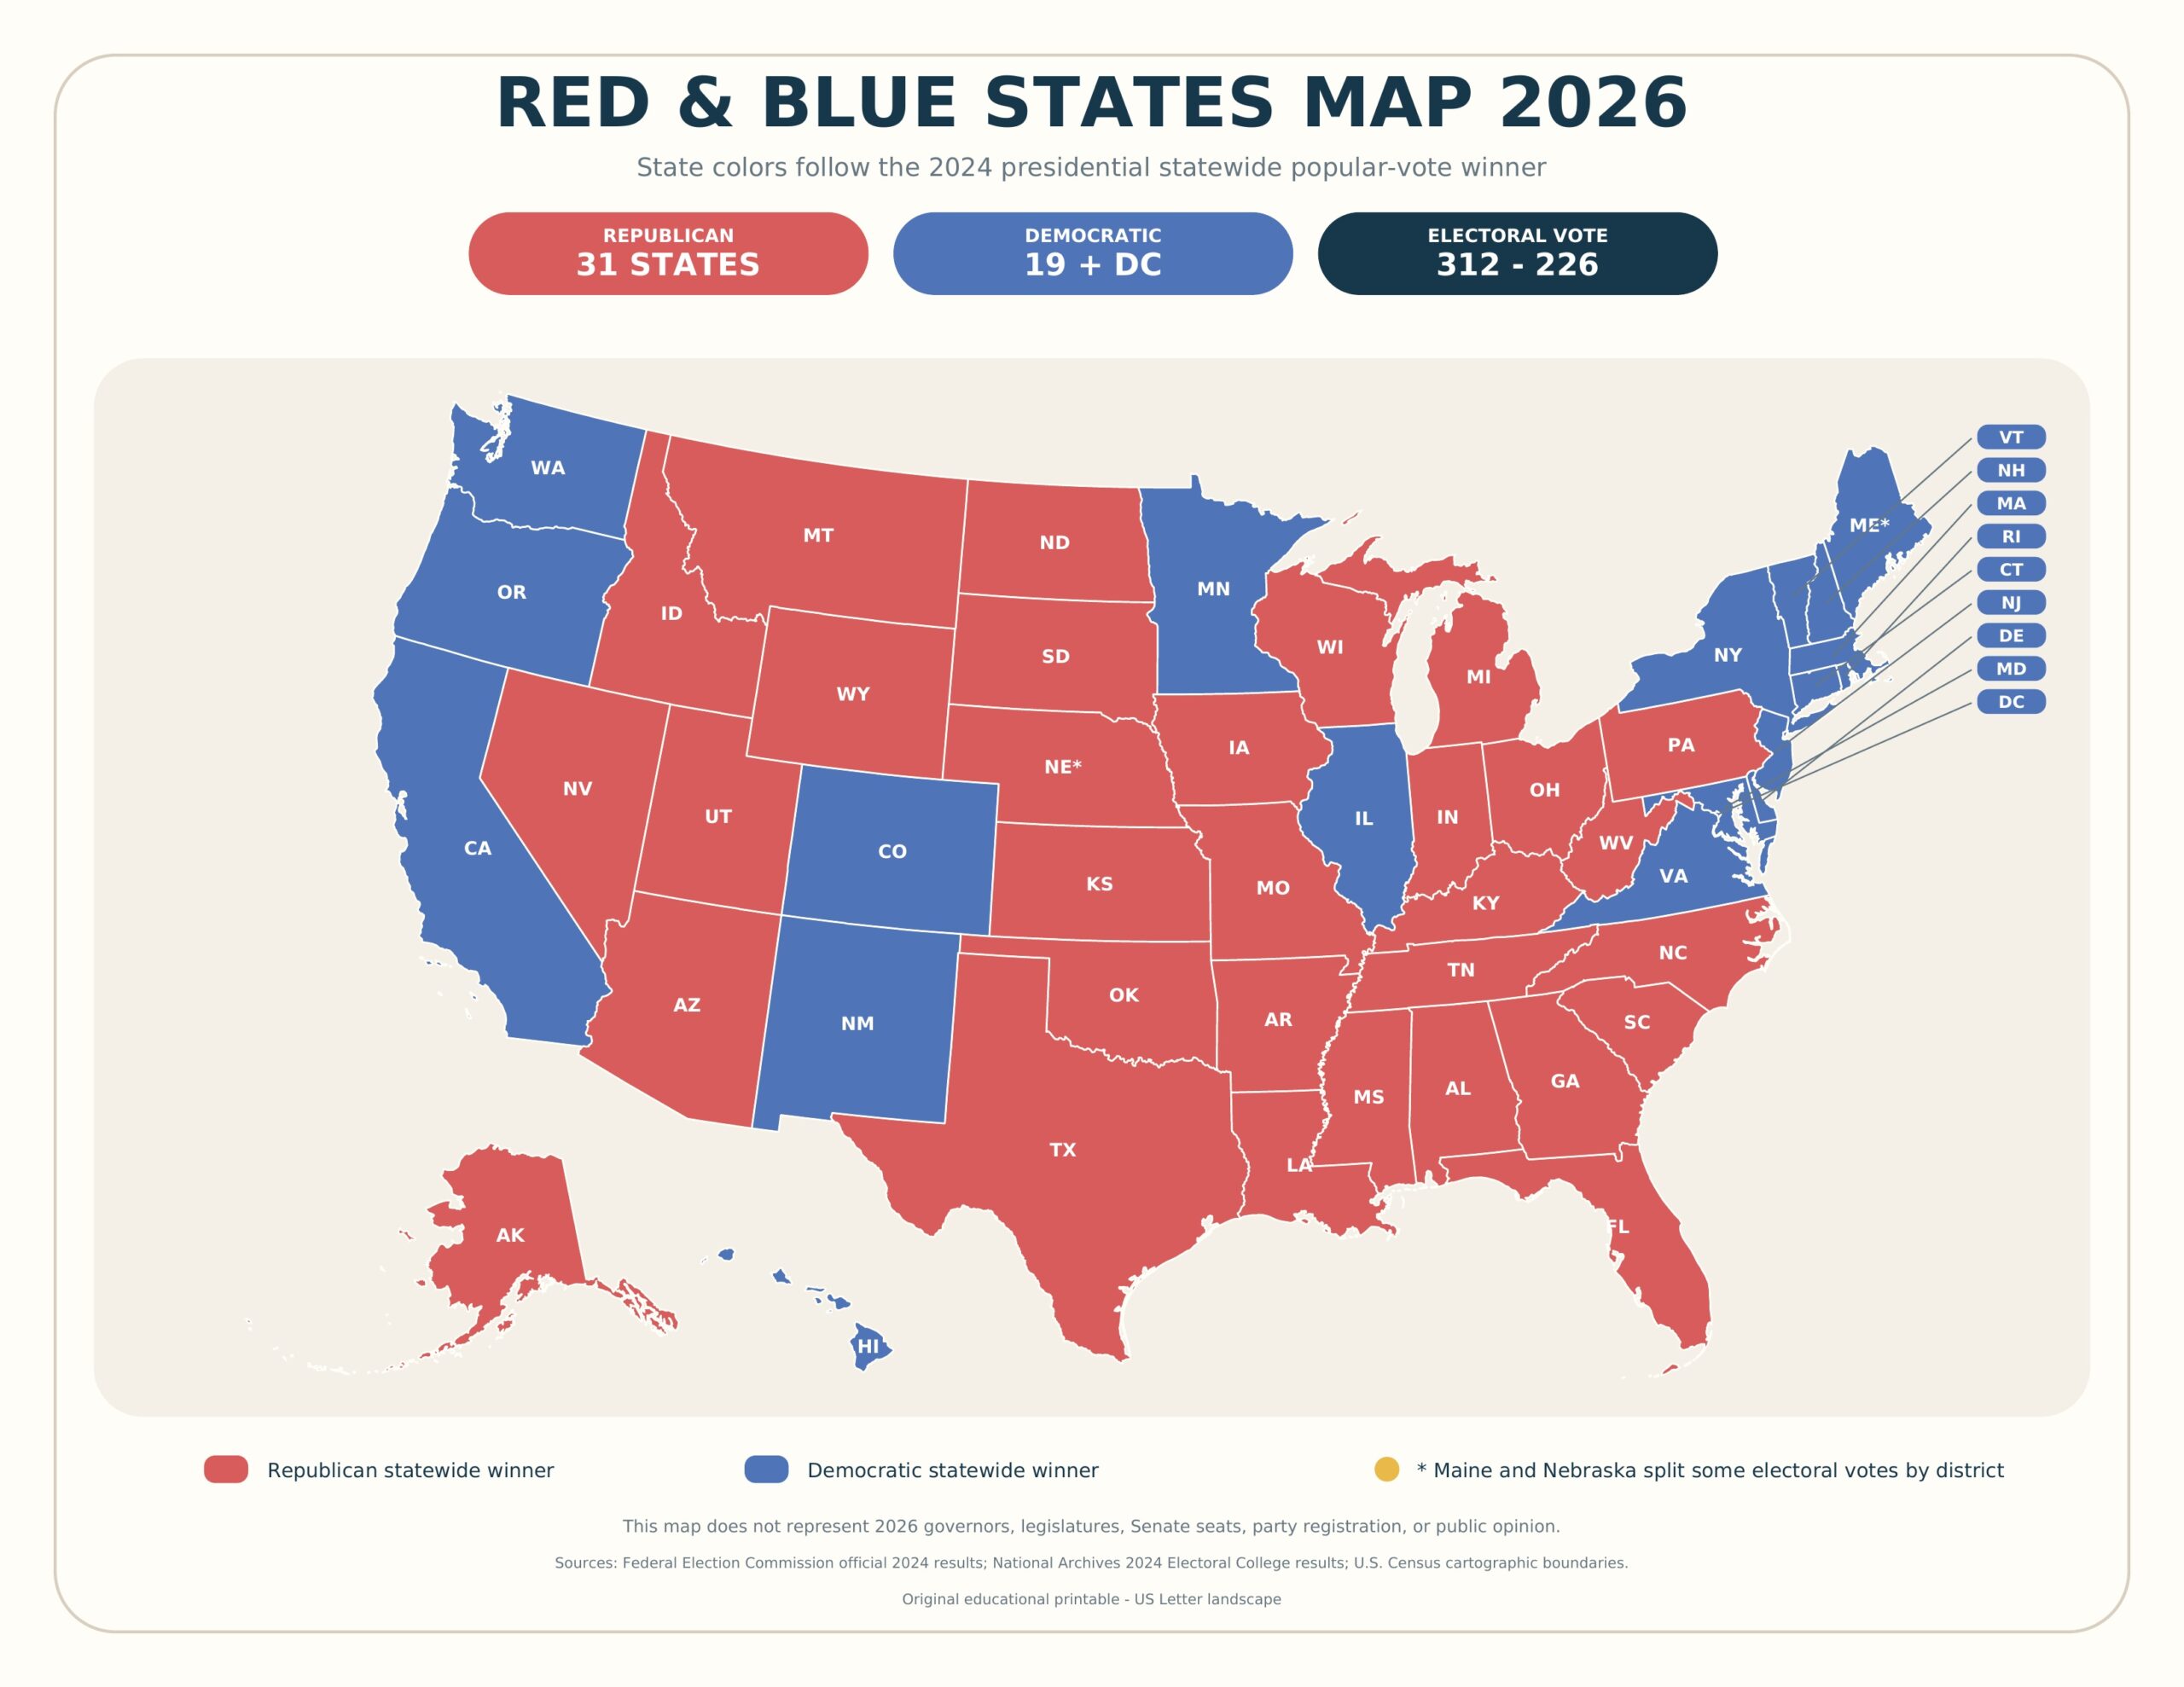
Map of Red and Blue States 2026 — This printable U.S. political map colors each state according to the winner of its statewide popular vote in the 2024 presidential election. Republican statewide winners are shown in red, while Democratic statewide winners are shown in blue. Washington, DC is also included in blue.
Because 2026 is a midterm election year rather than a presidential election year, there is no single official federal classification called the “red and blue states map 2026.” Different maps may instead show governors, state legislatures, U.S. Senate seats, voter registration, polling, or past presidential results. To make this printable objective and reproducible, the colors below use the most recent completed presidential statewide results: the November 5, 2024 general election.
Download the Red and Blue States Map 2026 PDF
Download the High-Resolution JPG
What Do Red States and Blue States Mean?
In modern U.S. election coverage, “red state” generally refers to a state won by the Republican presidential candidate, while “blue state” generally refers to a state won by the Democratic presidential candidate. These labels are a convenient visual shorthand, not permanent legal or governmental classifications.
A state can vote for one party’s presidential candidate while electing a governor, senator, legislature, or other officials from another party. Political preferences also vary within every state. Large cities, suburbs, small towns, and rural counties can produce very different voting patterns, so a statewide color should never be interpreted as describing every resident.
How This 2026 Red and Blue Map Was Created?
The map uses official 2024 presidential election results compiled from state election offices by the Federal Election Commission. The National Archives records an Electoral College result of 312 votes for Republican Donald J. Trump and 226 votes for Democrat Kamala D. Harris.
For a consistent state-level map, each state is filled using its statewide popular-vote winner. That rule produces 31 Republican-won states and 19 Democratic-won states. Washington, DC voted Democratic and is shown separately from the 50-state count.
- Red: 31 states won statewide by the Republican presidential ticket.
- Blue: 19 states won statewide by the Democratic presidential ticket.
- Washington, DC: Democratic and displayed in blue.
- Electoral College result: 312 Republican electoral votes to 226 Democratic electoral votes.
List of Red States on the 2026 Reference Map
The following 31 states were won statewide by the Republican presidential candidate in 2024 and are colored red:
- Alabama
- Alaska
- Arizona
- Arkansas
- Florida
- Georgia
- Idaho
- Indiana
- Iowa
- Kansas
- Kentucky
- Louisiana
- Michigan
- Mississippi
- Missouri
- Montana
- Nebraska
- Nevada
- North Carolina
- North Dakota
- Ohio
- Oklahoma
- Pennsylvania
- South Carolina
- South Dakota
- Tennessee
- Texas
- Utah
- West Virginia
- Wisconsin
- Wyoming
List of Blue States on the 2026 Reference Map
The following 19 states were won statewide by the Democratic presidential candidate in 2024 and are colored blue:
- California
- Colorado
- Connecticut
- Delaware
- Hawaii
- Illinois
- Maine
- Maryland
- Massachusetts
- Minnesota
- New Hampshire
- New Jersey
- New Mexico
- New York
- Oregon
- Rhode Island
- Vermont
- Virginia
- Washington
Washington, DC also supported the Democratic presidential candidate and is shown in blue, but it is a federal district rather than a state.
Why Maine and Nebraska Have Special Notes?
Most states award all their presidential electoral votes to the statewide winner. Maine and Nebraska use a different allocation method: two electoral votes are tied to the statewide result, while additional votes are awarded according to the winner in each congressional district.
That means a simple one-color state map cannot display every detail of their Electoral College allocation. On this printable, Maine is blue because the Democratic ticket won the statewide vote, and Nebraska is red because the Republican ticket won the statewide vote. An asterisk reminds readers that their district-level electoral votes were split.
The National Archives reports that Maine awarded three electoral votes to Harris and one to Trump, while Nebraska awarded four to Trump and one to Harris. These district exceptions are already included in the national 312–226 electoral-vote total.
Which States Changed Color from 2020 to 2024?
Comparing presidential statewide winners, six states moved from Democratic in 2020 to Republican in 2024:
- Arizona
- Georgia
- Michigan
- Nevada
- Pennsylvania
- Wisconsin
These states are often discussed as electoral battlegrounds because recent presidential contests have been competitive or because their statewide winner has changed between election cycles. However, “swing state” has no fixed official list, and competitiveness can change over time.
What This Map Does Not Show?
The printable is intentionally limited to one clearly defined measure. It does not claim to show every dimension of U.S. politics in 2026.
- Governors: A state’s governor may belong to a different party than its 2024 presidential winner.
- State legislatures: Control of state House and Senate chambers is not represented.
- U.S. Senate or House seats: Congressional delegations can contain members of both major parties.
- County-level voting: Substantial political variation exists within each state.
- Party registration: Registration systems and totals differ by state.
- 2026 polling: The map does not use surveys, forecasts, or projected midterm results.
- Public opinion: Statewide election results do not describe the beliefs of every resident.
Why Is There No Single Official Red and Blue Map for 2026?
Federal midterm elections are scheduled for 2026, but voters do not elect a president during a midterm. They vote on all U.S. House seats, a portion of U.S. Senate seats, and numerous state and local offices. Each contest has its own geographic result.
As a result, a map labeled only “red and blue states 2026” needs a stated methodology. It could reasonably be based on the latest presidential vote, party of the governor, legislative control, or another measure. Two maps using different definitions can both be factually correct while showing different colors.
This page avoids that ambiguity by consistently using 2024 presidential statewide winners as the basis for a 2026 reference map.
How to Use the Printable Map
- Classroom lessons: Introduce the Electoral College, statewide voting, and the limits of two-color political maps.
- Election reference: Review the state-level result of the most recent presidential election.
- Presentations: Use the high-resolution JPG in slides or educational materials.
- Worksheets: Ask students to identify regions, count states, or compare this map with an earlier election.
- Personal study: Print the PDF and annotate battleground states, electoral votes, or regional patterns.
How to Print the Map
- Download and open the PDF file.
- Select US Letter paper.
- Choose landscape orientation.
- Select “Fit” or “Fit to printable area.”
- Print in color so red and blue states remain easy to distinguish.
The high-resolution JPG is suitable for screens and presentations. The PDF is recommended for home, school, or office printing because it preserves the intended one-page layout.
Frequently Asked Questions
How many red and blue states are on this map?
Using the 2024 presidential statewide popular-vote winner, the map contains 31 red states and 19 blue states. Washington, DC is also blue but is not included in the state count.
Is Florida red or blue on this 2026 map?
Florida is red because the Republican presidential candidate won the state’s popular vote and all 30 of its electoral votes in the 2024 general election.
Is this map a forecast for the 2026 election?
No. It is a historical reference based on completed 2024 presidential results. It does not predict 2026 House, Senate, gubernatorial, or state-legislative elections.
Can a red state have a Democratic governor?
Yes. Red and blue labels depend on the measurement being used. A state can support a Republican presidential candidate while electing a Democratic governor or other Democratic officials, and the reverse can also occur.
Why is Washington, DC included?
Washington, DC is not a state, but the Twenty-Third Amendment gives it participation in presidential elections through the Electoral College. It cast three electoral votes in 2024.
Is the printable free?
Yes. The PDF and JPG on this page may be downloaded for personal, classroom, and noncommercial educational use.
Official Sources and Methodology
Election results were checked against the Federal Election Commission’s official 2024 presidential general election results, compiled from state election offices, and the National Archives 2024 Electoral College results. State boundary geometry was derived from U.S. Census cartographic boundary data. The map is an educational visualization, not an official government publication or election forecast.